never changed
Most prices did not move at all.
A longitudinal analysis of how a regional grocery chain actually moves its prices.
Most prices did not move at all.
Price activity came from promotions, not permanent resets.
The items that moved changed sharply.
Promotional price versus regular price.
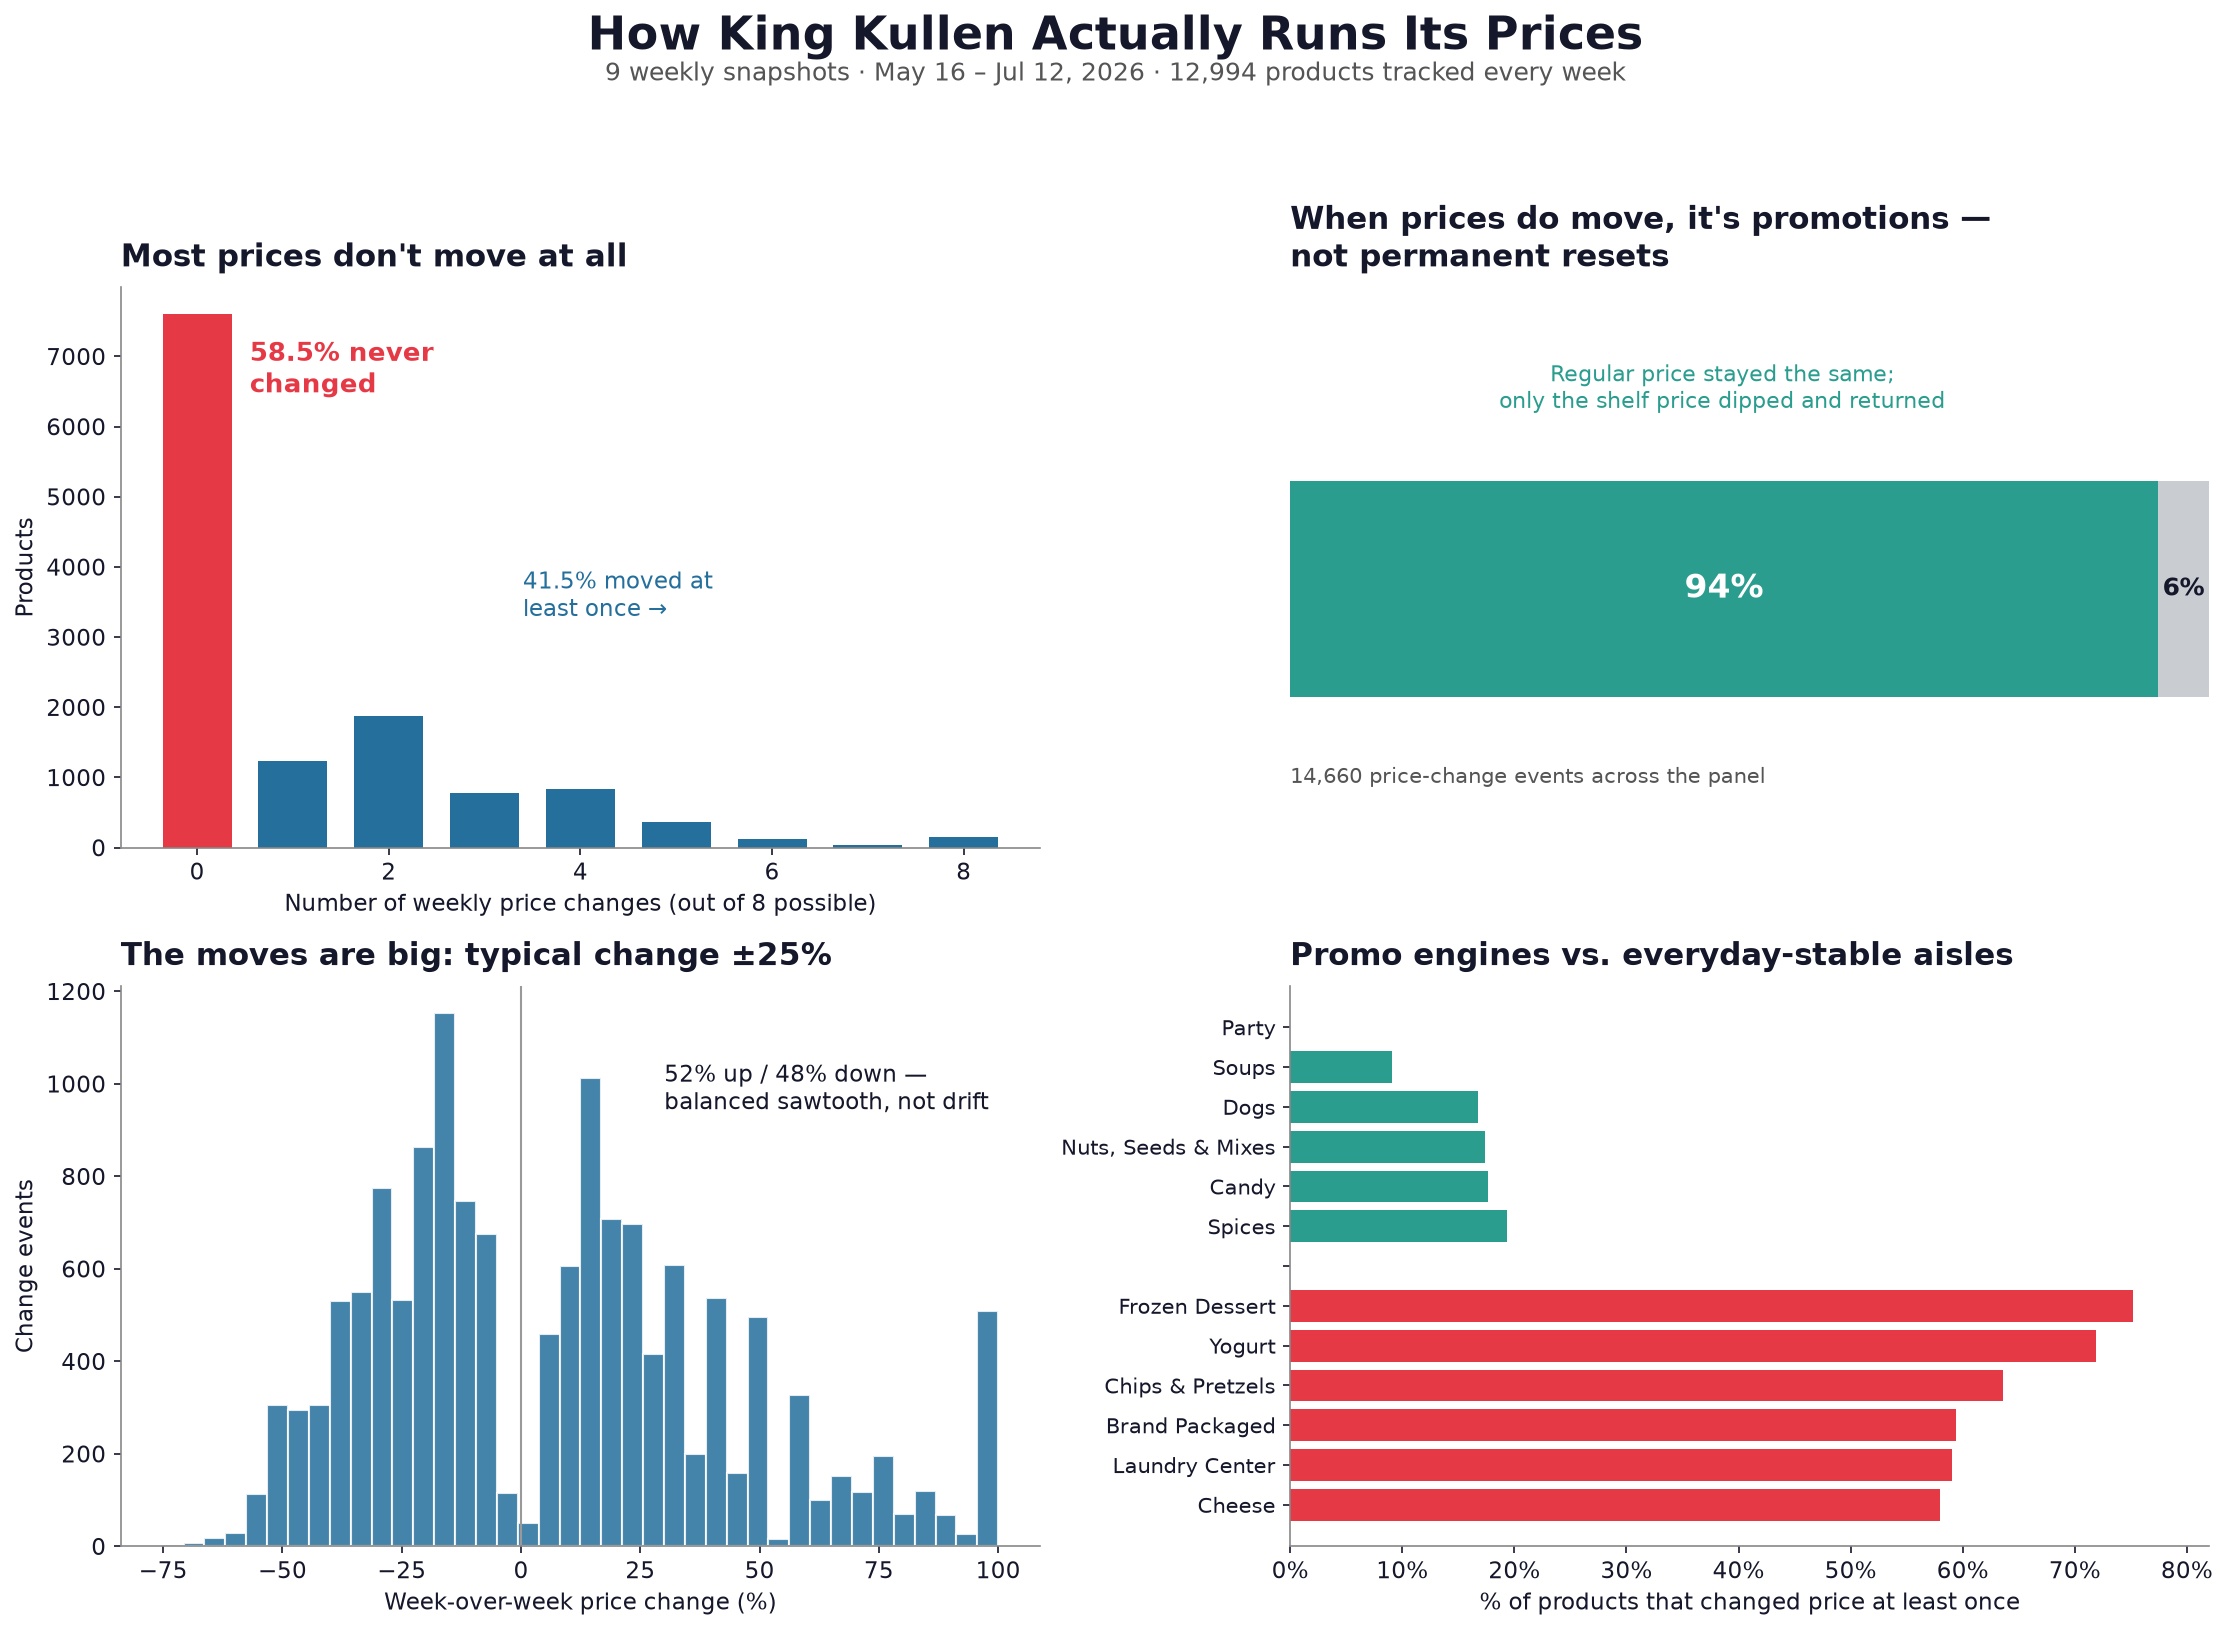
Across 12,994 products tracked for nine consecutive weeks, most prices did not move at all.
When they did, the movement was overwhelmingly promotional: the shelf price dipped and returned while the regular price held.
The typical change was large, and the activity clustered in a handful of promotional aisles.
The source is an automated weekly capture of King Kullen's public online catalog. Each record carries a UPC, product name, category, current price, and regular price. That current-versus-regular pair allows promotion detection without guessing from labels.
Why only King Kullen? Stop & Shop had only two snapshots in the window and no shared UPC key. A competitor-leadership claim would not have been supported by the available overlap.
Over nine weeks, 58.5% of products never changed price. The remaining 41.5% moved in discrete steps, with a median absolute week-over-week change of 25.1%.
Of 14,660 price-change events, 94% occurred while the regular price stayed flat. Only 6% accompanied a change in the regular price itself.
Frozen Dessert, Yogurt, Chips & Pretzels, Soda Pop, and Water formed the promotional engine. Party, Soups, pet food, Candy, and pantry staples stayed comparatively stable.
Diet Pepsi, Hidden Valley Ranch, and bi-color corn repeatedly returned to the same high and low price levels. The lockstep movement across related items points to a category-wide promotional calendar.
Three products, three aisles, the same sawtooth rhythm.
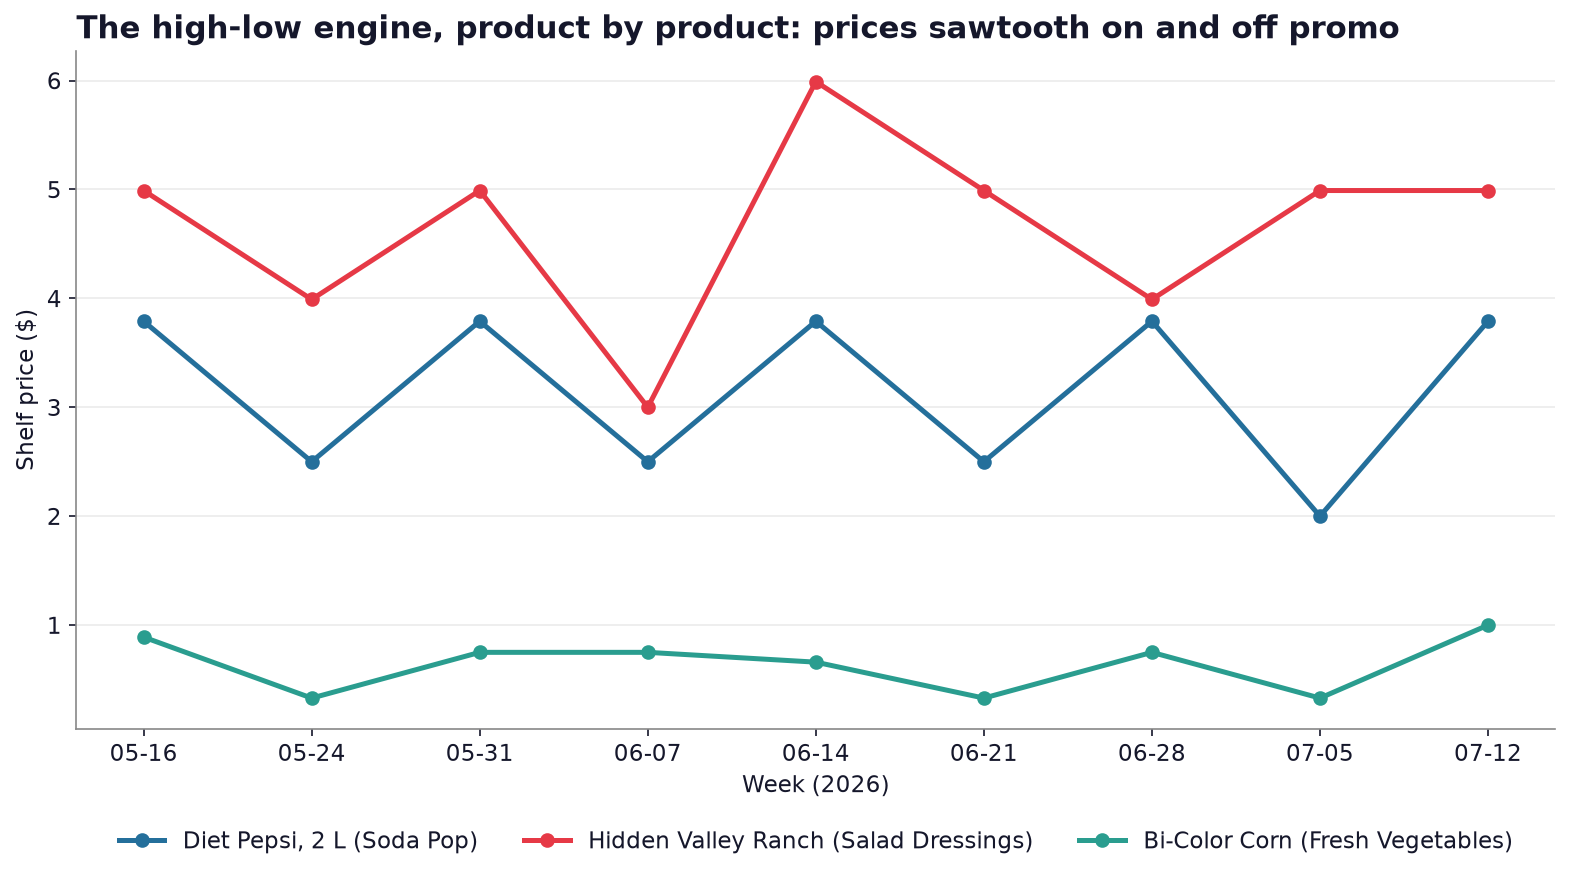
King Kullen runs a high-low promotional model, not an everyday-low-price model.
The cleaned panel and category summary are included. The raw storefront snapshots remain in the separate source repository.
Download the panel CSV
Download the category summary
View the analysis code
KingKullenResearch
Weekly public catalog snapshots
May 16 – July 12, 2026